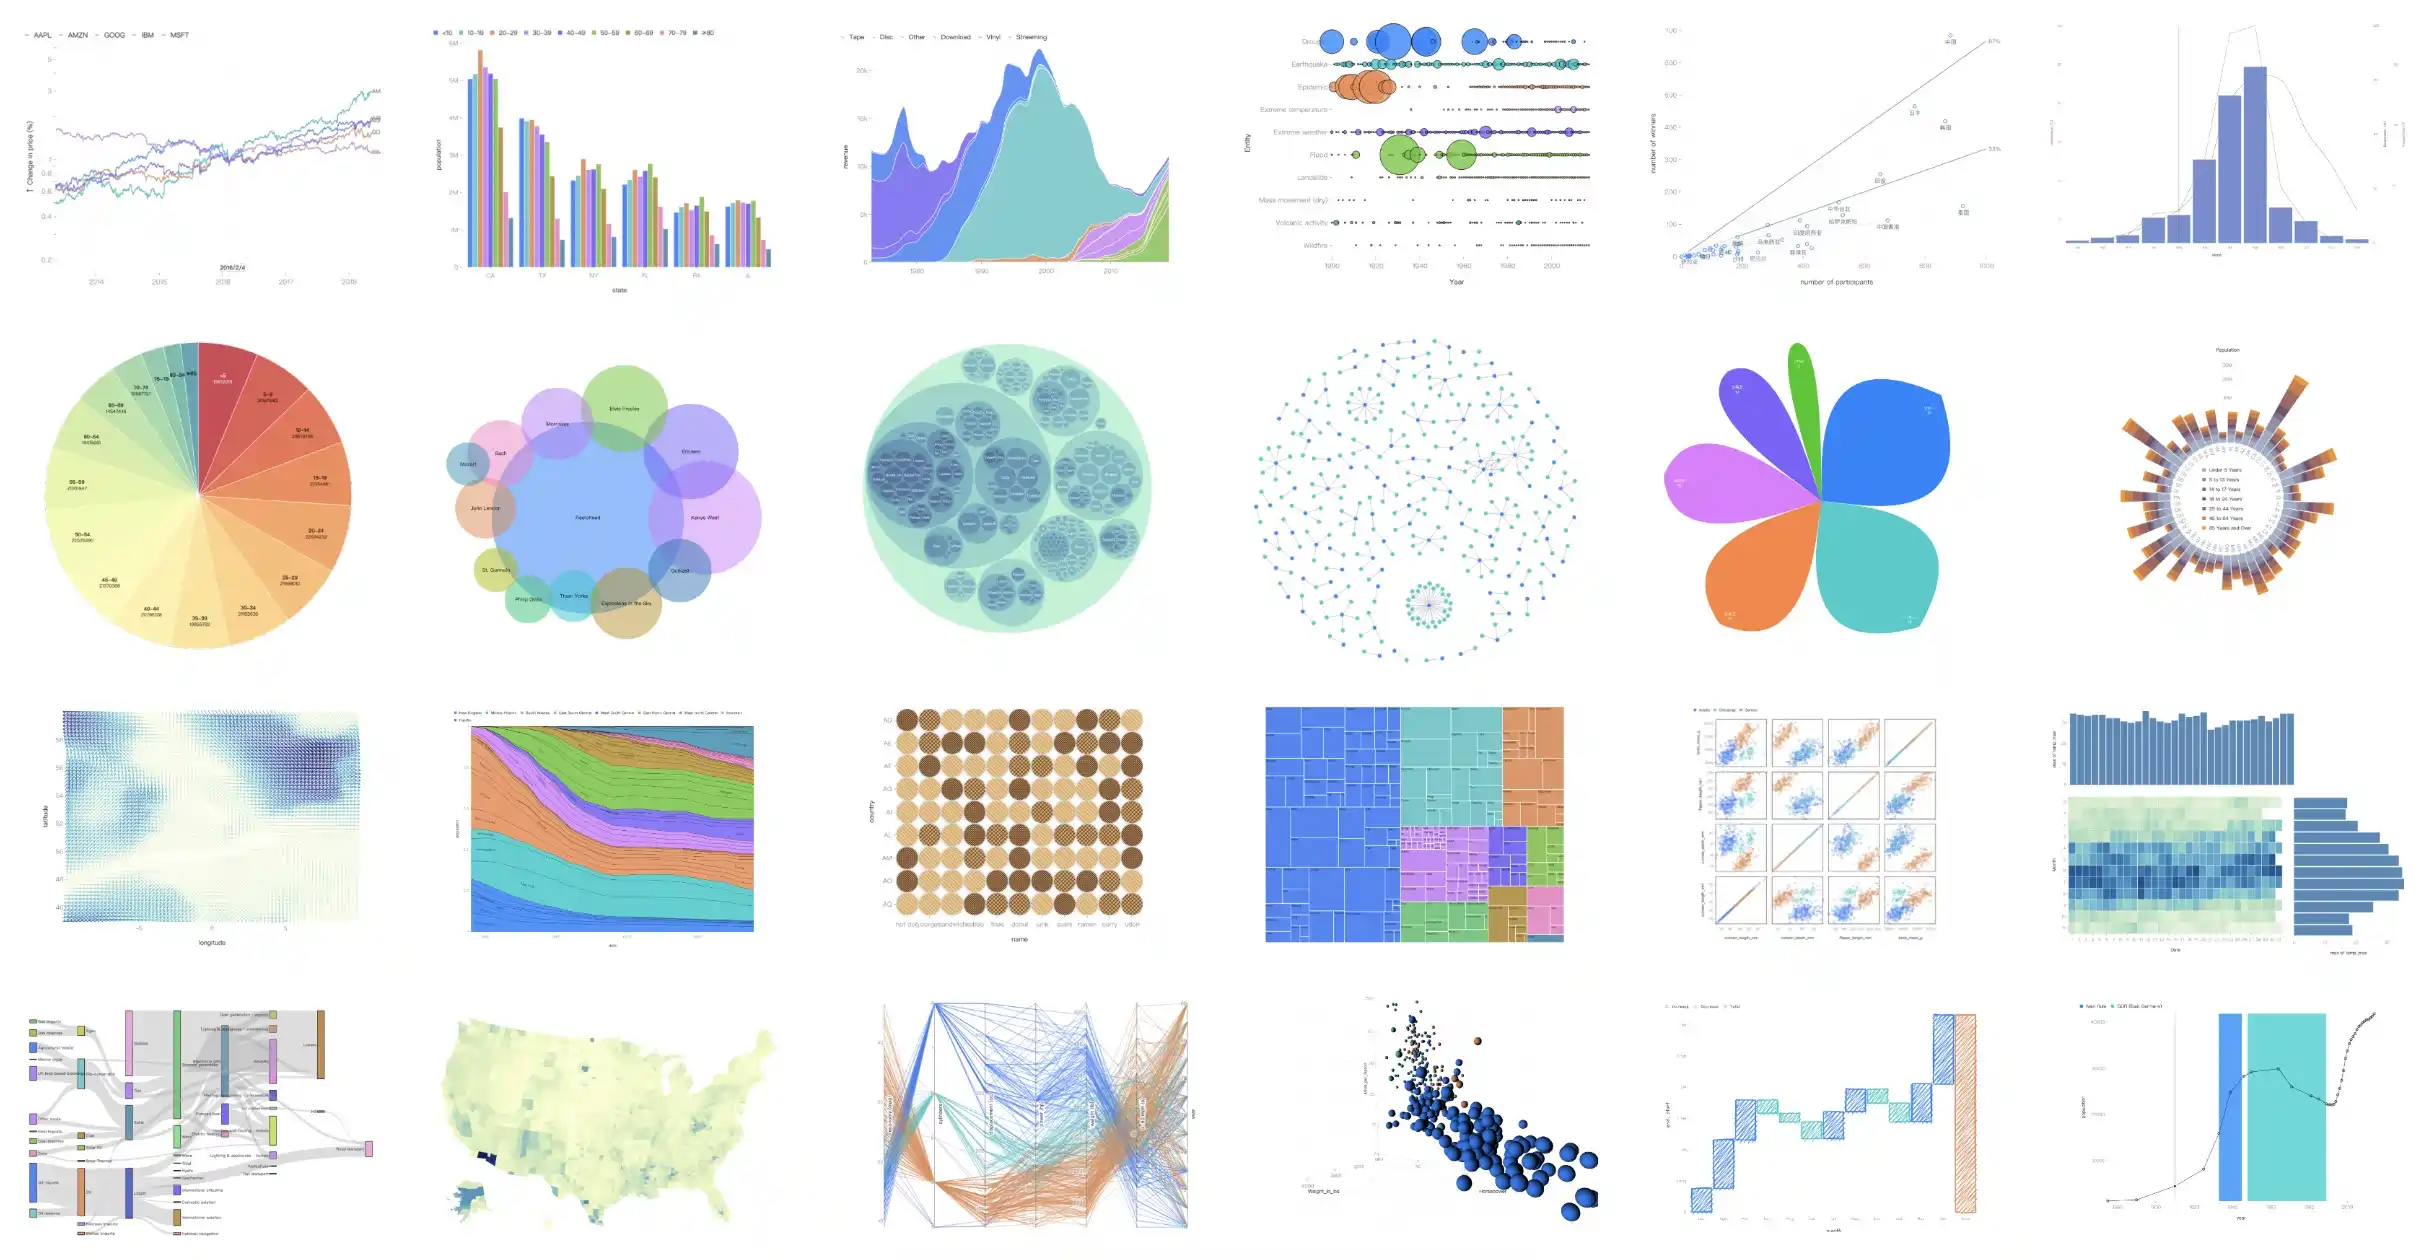
hub / github.com/antvis/G2
github.com/antvis/G2 @v5.4.8 sqlite
2,719 symbols
10,485 edges
1,807 files
111 documented · 4%
README
![]() English | 简体中文
English | 简体中文
G2:一套简明和渐进式的可视化语法
简洁的渐进式可视化语法,用于构建仪表盘、数据探索以及数据讲故事。
![]()


![]()
G2 起源于 Leland Wilkinson 的图形语法:《The Grammar of Graphics》,但又不止于图形语法。
✨ 特色
- 渐进式语法:结合工业和学术实践,实现图形语法、动画语法和交互语法。
- 丰富的标记:内置 10+ 基础标记,8+ 高阶标记。
- 高可扩展性:提供统一机制扩展所有可视化组件。
- 个性化风格:支持手绘、圆角、纹理等风格。
- 多环境渲染:支持 Canvas、SVG 以及 WebGL,和 Node.js 服务端渲染。
🔨 开始使用
可以通过 NPM 或 Yarn 等包管理器来安装。
$ npm install @antv/g2
$ yarn add @antv/g2
成功安装之后,可以通过 import 导入 Chart 对象。
import { Chart } from '@antv/g2';
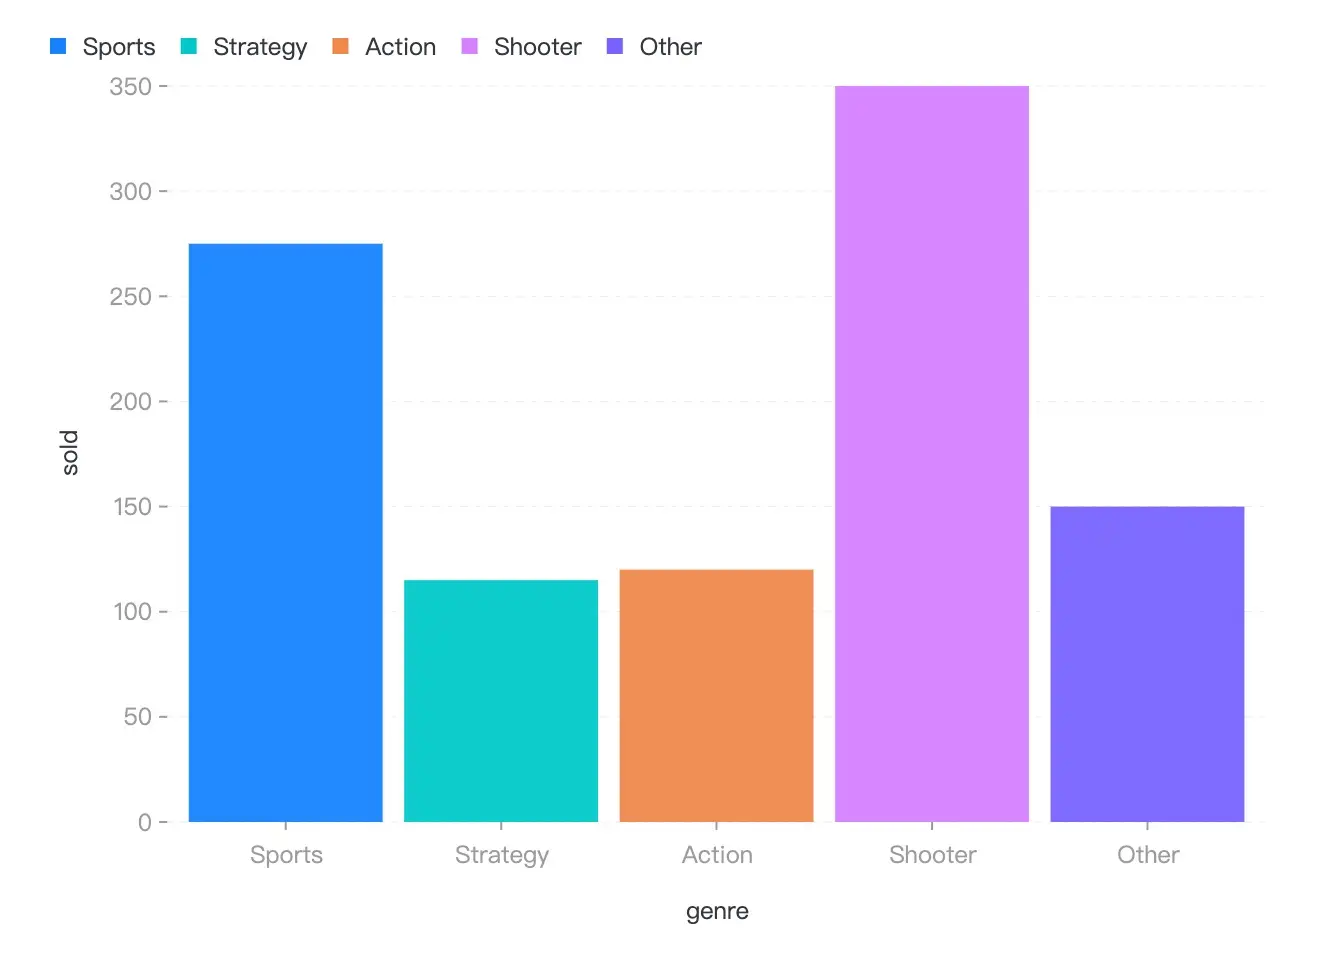
// 准备数据
const data = [
{ genre: 'Sports', sold: 275 },
{ genre: 'Strategy', sold: 115 },
{ genre: 'Action', sold: 120 },
{ genre: 'Shooter', sold: 350 },
{ genre: 'Other', sold: 150 },
];
// 初始化图表实例
const chart = new Chart({
container: 'container',
});
// 声明可视化
chart
.interval() // 创建一个 Interval 标记
.data(data) // 绑定数据
.encode('x', 'genre') // 编码 x 通道
.encode('y', 'sold') // 编码 y 通道
.encode('color', 'genre'); // 编码 color 通道
// 渲染可视化
chart.render();
如果一切顺利,你可以得到下面的柱状图!
🌍 生态
- g2-react - G2 的轻量级 React 组件,没有额外特性。
- g2-extensions - G2 的一系列插件库,包含 3D 和智能可视化等。
- ant-design-charts - React 图表库,基于 G2, G6, X6, L7Plot.
- 更多...
📮 参与贡献
感谢所有为这个项目做出贡献的人,感谢所有支持者!🙏

📄 许可证
MIT@AntV.
Extension points exported contracts — how you extend this code
FilterDataByDomainOptions (Interface)* Options for filtering data by domain. * Uses Mark[] type for better type safety.
src/interaction/sliderFilter.ts
SVGDifference (Interface)
* Compare two SVG strings and find differences.
__tests__/integration/utils/toMatchDOMSnapshot.ts
Chart (Interface)
(no doc)
src/index.ts
Node (Interface)
(no doc)
src/utils/treeDataTransform.ts
PartitionDataNode (Interface)
(no doc)
src/mark/partition.ts
Item (Interface)
(no doc)
src/data/utils/d3-cloud/index.ts
MarkNode (Interface)
(no doc)
src/api/mark.ts
PartitionNode (Interface)
(no doc)
src/spec/mark.ts
Core symbols most depended-on inside this repo
stylecalled by 851
src/utils/selection.ts
render
called by 631
src/api/runtime.ts
map
called by 580
src/interaction/adaptiveFilter.ts
data
called by 561
src/utils/selection.ts
attr
called by 402
src/api/node.ts
createElement
called by 349
src/utils/selection.ts
push
called by 240
src/api/node.ts
on
called by 230
src/api/runtime.ts
Shape
Languages
TypeScript100%
Modules by API surface
src/interaction/utils.ts58 symbols
src/interaction/tooltip.ts56 symbols
src/runtime/plot.ts54 symbols
src/runtime/component.ts48 symbols
src/runtime/scale.ts43 symbols
src/interaction/brushHighlight.ts41 symbols
src/api/runtime.ts36 symbols
src/interaction/legendFilter.ts31 symbols
src/runtime/layout.ts29 symbols
src/utils/helper.ts27 symbols
src/data/utils/d3-sankey/sankey.ts27 symbols
src/utils/selection.ts24 symbols
Used by 5 indexed graphs manifest dependencies, hub-wide
Dependencies from manifests, versioned
@ant-design/icons4.8.3 · 1×
@antv/component2.1.9 · 1×
@antv/coord0.4.7 · 1×
@antv/data-set0.11.8 · 1×
@antv/dumi-theme-antv0.8.0-beta.25 · 1×
@antv/event-emitter0.1.3 · 1×
@antv/expr1.0.2 · 1×
@antv/g6.1.24 · 1×
@antv/g-canvas2.0.43 · 1×
@antv/g-lottie-player1.0.32 · 1×
@antv/g-old1×
@antv/g-pattern2.0.35 · 1×