github.com/holoviz/hvplot @v0.12.2a1
Chat with this repoBrowse by type
What it actually does AI analysis from the code graph — generated when you open this
README

<em>hvPlot makes data analysis and visualization simple</em>
| Downloads |   |
| Build Status |  |
| Coverage |  |
| Latest dev release |   |
| Latest release |      |
| Python |  |
| Docs |   |
| Binder |  |
| Support |  |
Home | Installation instructions | Getting Started Guide | Gallery | Reference | Examples | License | Support
hvPlot provides a familiar, high-level API for visualization
The API is based on the familiar Pandas .plot API and the innovative .interactive API.

hvPlot works with the tools you know and love
hvPlot
- supports a wide range of data sources including Pandas, Polars, XArray, Dask, Streamz, Intake, GeoPandas and NetworkX.
- supports the plotting backends Bokeh, Matplotlib and Plotly.
- exposes the powerful tools from the HoloViz ecosystem in a familiar and convenient API.
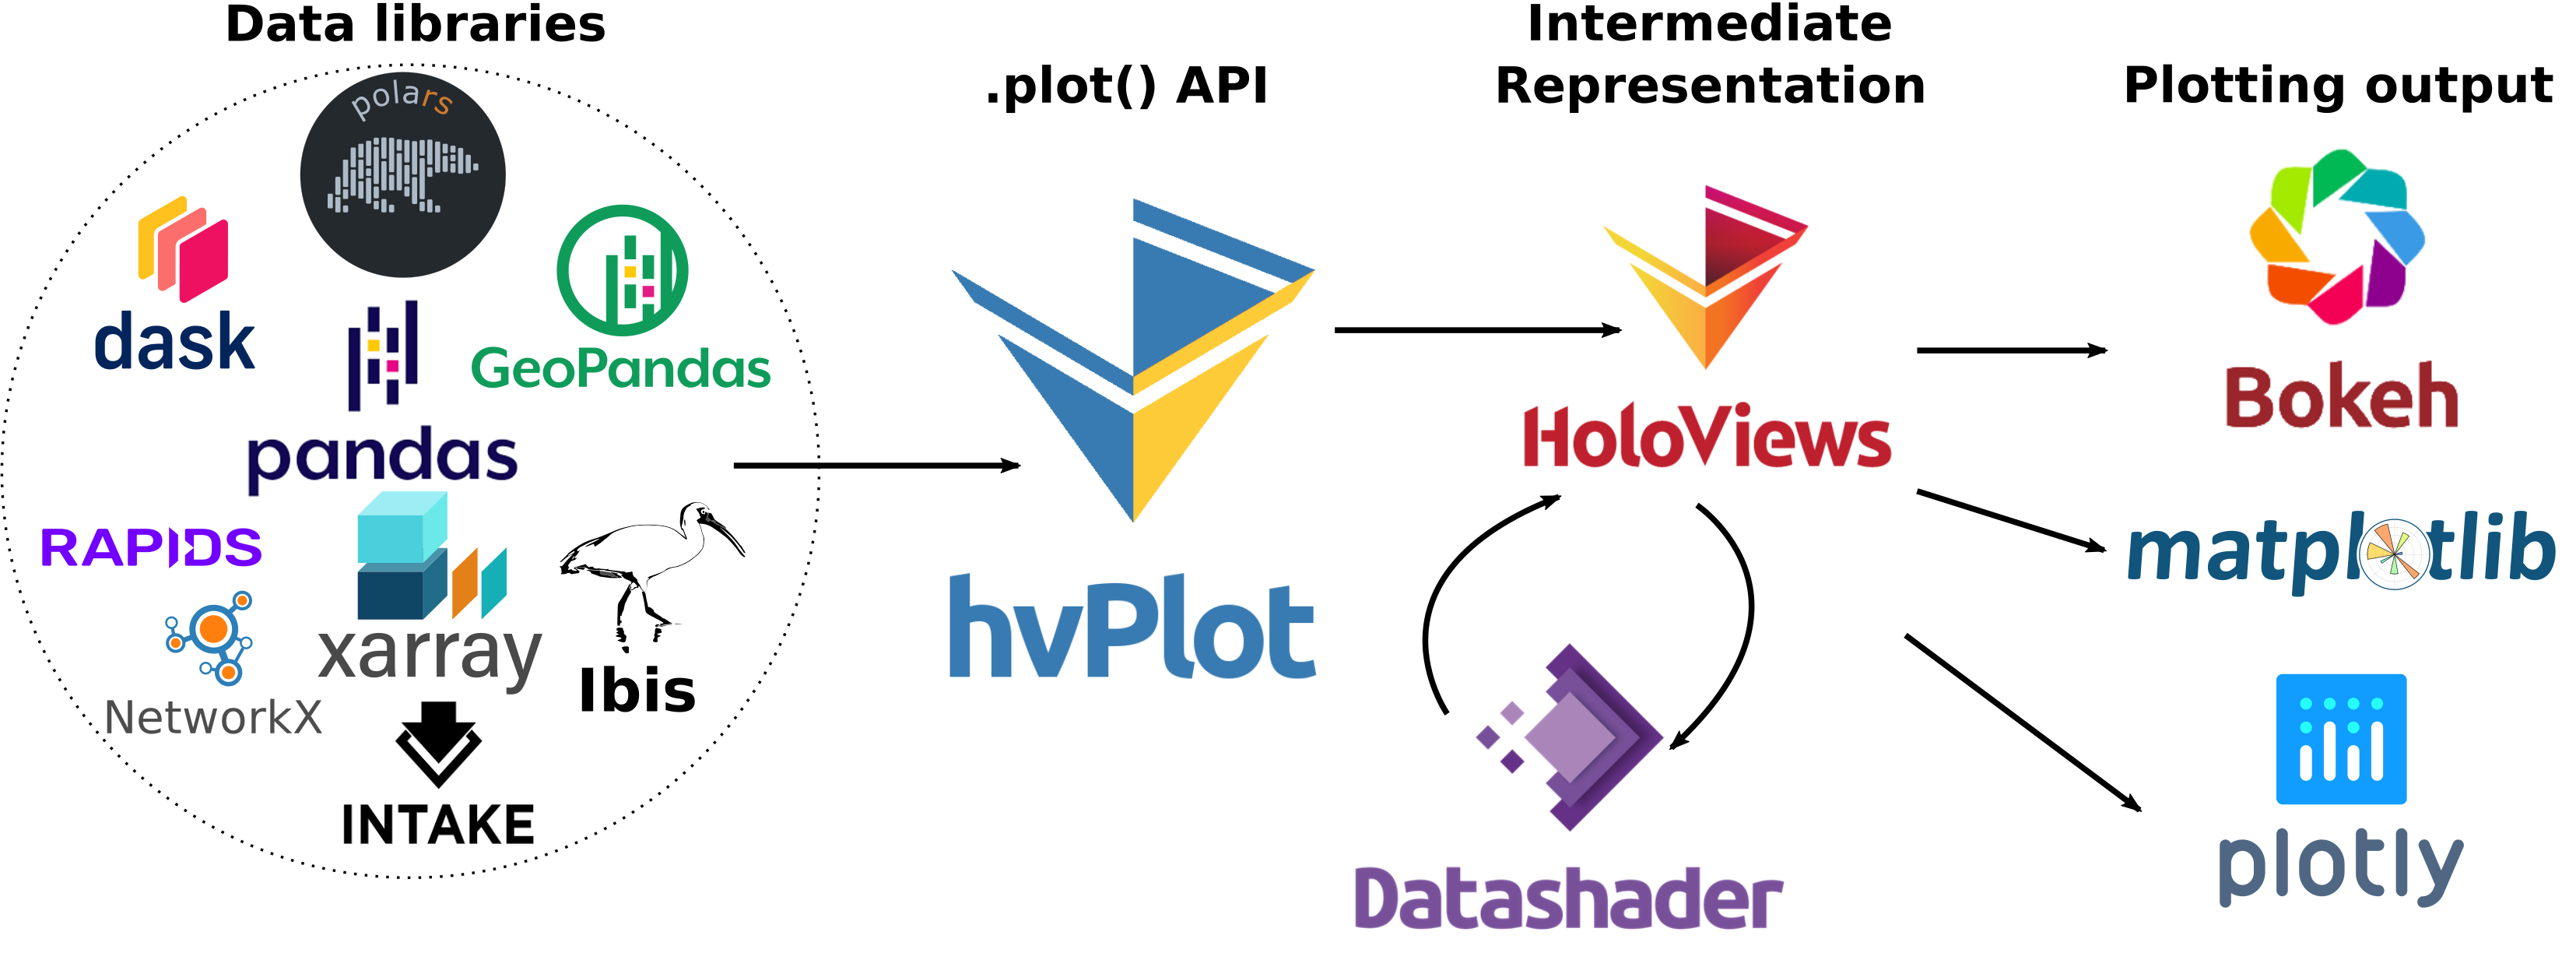
hvPlot is the simplest way to benefit from the HoloViz ecosystem for data exploration.
hvPlot can be used for exploration, reporting and data apps
Check out this blog post to see how easy it is to create an interactive dashboard with hvPlot and Panel.

Mini getting-started
Head over to the getting started guide for more!
Install
hvPlot can be installed on Linux, Windows, or Mac with conda:
conda install hvplot
or with pip:
pip install hvplot
Plotting data
Work with your data source:
import numpy as np
import pandas as pd

idx = pd.date_range('1/1/2000', periods=1000)
df  = pd.DataFrame(np.random.randn(1000, 4), index=idx, columns=list('ABCD')).cumsum()
Import the hvPlot extension for your data source and optionally set the plotting backend:
import hvplot.pandas
# Optional: hvplot.extension('matplotlib') or hvplot.extension('plotly')
Use the .hvplot API as you would use the Pandas or Xarray .plot API:
df.hvplot()

Interactive data apps
Just add .interactive and replace your normal arguments with Panel widgets or Ipywidgets.
import panel as pn
pn.extension()

df.interactive(width=600).head(n=pn.widgets.IntSlider(start=1, end=5, value=3))

How to find documentation from your notebook or editor
To see the available arguments for a specific kind of plot run
hvplot.help(kind='scatter')
In a notebook or ipython environment the usual
helpand?will provide you with documentation.TABandSHIFT+TABcompletion will help you navigate.
License
hvPlot is completely free and open-source. It is licensed under the BSD 3-Clause License.
Support & Feedback
- Usage questions and showcases -> HoloViz Community
- Bug reports and feature requests -> Github
- Developer discussions -> Discord
For more detail check out the HoloViz Community Guide.
Contributions
We would love to work with you no matter whether you want to contribute to issue management, PRs, documentation, blog posts, community support or social media communication.
To get started with the code or docs check out the Developer Guide.
Core symbols most depended-on inside this repo
Shape
Languages
Modules by API surface
Used by 2 indexed graphs manifest dependencies, hub-wide
For agents
$ claude mcp add hvplot \
  -- python -m otcore.mcp_server <graph>